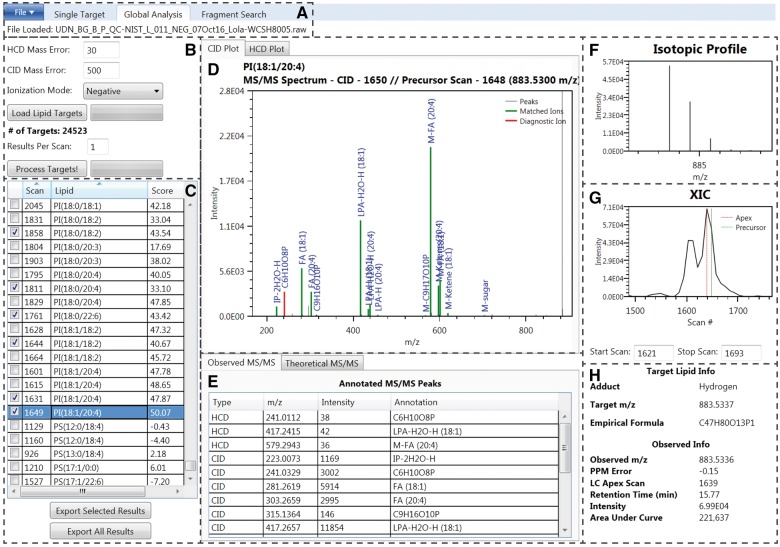
Fig. 1.
LIQUID interface. (A) File input. (B) Search parameters. (C) Table of output. Checked boxes denote validated identifications. The highlighted species, PI(18:1/20:4), is selected as an example for the remaining displayed features. (D) MS/MS spectra with annotated diagnostic (red) and fragment ions (green). (E) List of observed MS/MS fragments, including their structural annotations. The theoretical MS/MS fragments for the associated lipid species are also available. (F) Isotopic profile of the lipid species selected for MS/MS analysis and generated using data from MS scans. (G) Extracted ion chromatogram (XIC) for the precursor ion. The peak apex is highlighted in red while the nearest MS level scan is highlighted green. Peak start and stop scan numbers can be input for determination of peak area, which is shown in (H). (H) Target lipid information

