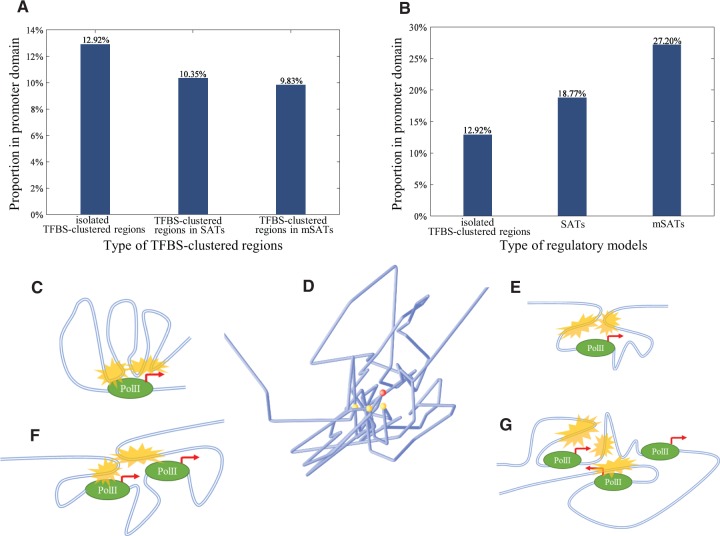
Fig. 2.
Spatial and regulatory characteristics of SATs. (A) Proportions of TFBS-clustered regions in different regulatory models located in promoter domains. (B) Proportions of different types of regulatory models located in promoter domains. (C) The previous regulatory model. An upstream SAT (yellow marks) regulates one gene. (D) Reconstructed chromosomal conformation showing spatial relationship between an mSAT (yellow dots) and the regulated gene (red dot). Blue lines represent chromatin structure. (E) SAT model where the regulated gene is located between two TFBS-clustered regions. (F) SAT model where multiple regulated genes are located between two TFBS-clustered regions. (G) mSAT model where multiple genes are regulated by multiple TFBS-clustered regions combined

