Fig. 2.

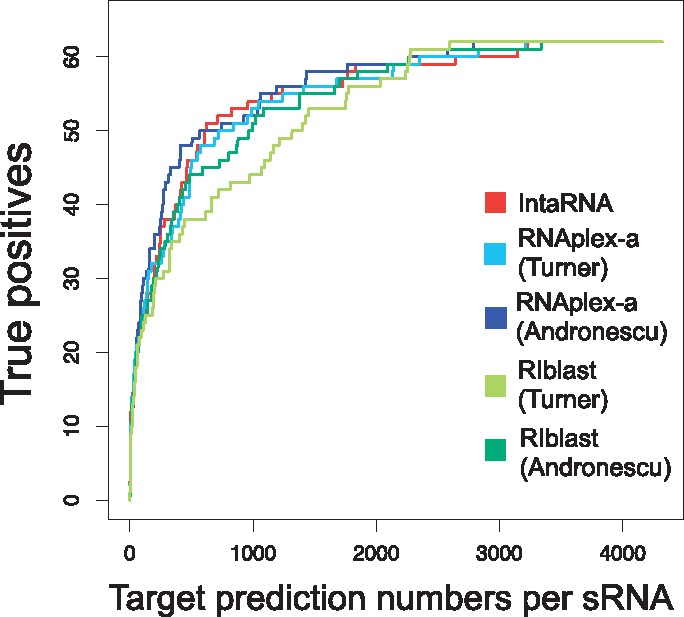
The performance of bacterial sRNA target prediction. The x- and y-axes represent target prediction numbers per sRNA and true positives, respectively.

The performance of bacterial sRNA target prediction. The x- and y-axes represent target prediction numbers per sRNA and true positives, respectively.