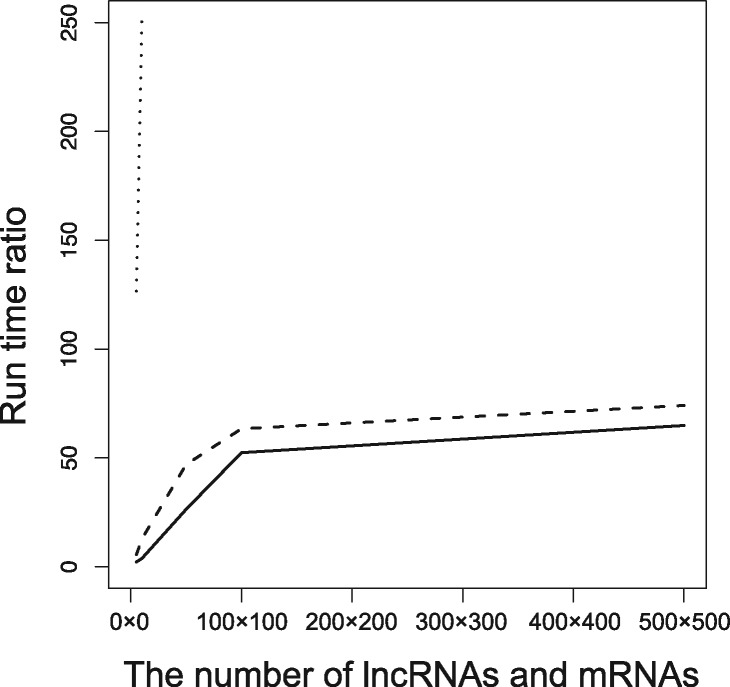
Fig. 4.
The results of the run time evaluation on partial human lncRNA and mRNA datasets. The x-axis represents the number of lncRNAs and mRNAs. The y-axis represents the runtime ratio of each program to RIblast. The dotted line, the dashed line and the solid line represent the performances of IntaRNA, RNAplex-a and RIblast, respectively

