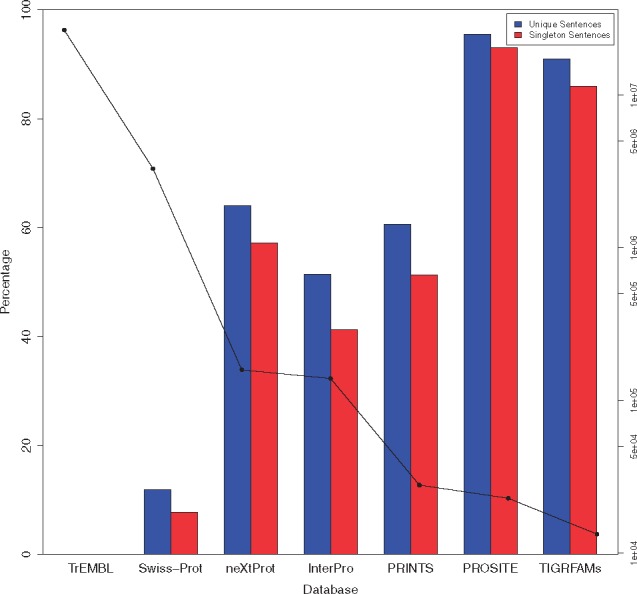
Fig. 1.

Figure showing the percentage of singleton (red/right hand column) and unique (blue/left hand column) sentences in each analyzed database. The line graph represents the total number of sentences in the database (shown on log scales). Within this graph we can broadly see that the larger the database, the more redundant its annotation (Color version of this figure is available at Bioinformatics online.)
