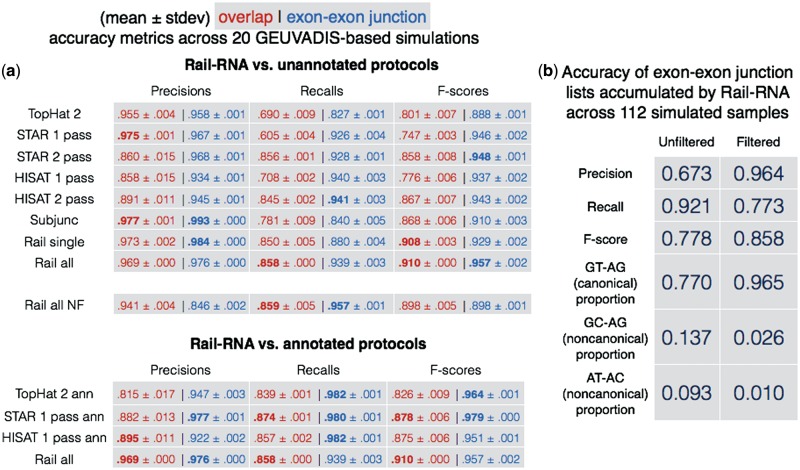
Fig. 2.
Accuracy comparisons. (a) Means and standard deviations of accuracy measures of various alignment protocols across 20 simulated samples whose FPKMs mimic those of 20 GEUVADIS samples. ‘Rail all’ protocols involve running Rail-RNA on all 112 simulated samples. Overlap accuracy is shown in red, exon–exon junction accuracy in blue. Some tools are run with (top table) and without (bottom table) a provided gene annotation. Note that Rail-RNA never uses an annotation. For Rail-RNA versus unannotated protocols, the best two results in each column are in boldface, and for Rail-RNA versus annotated protocols, the best result in each column is in boldface. (b) Rail-RNA’s accuracy on two sets of exon–exon junctions found across all 112 simulated samples: one before and one after application of the exon–exon junction filter

