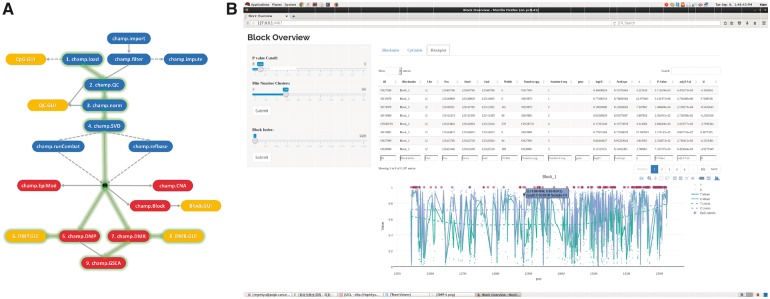
Fig. 1.
The ChAMP pipeline. (A) All functions included in ChAMP. Blue functions used for data preparation. Red functions used to generate analysis results. Yellow functions are GUI functions for visualization. Functions and edges with light green gleam stands for main pipeline (markers are steps for using ChAMP). Dash lines mean functions may not necessarily required. (B) GUI function for visualization of a DMB. The left panel displays parameters for controlling the plot and the table

