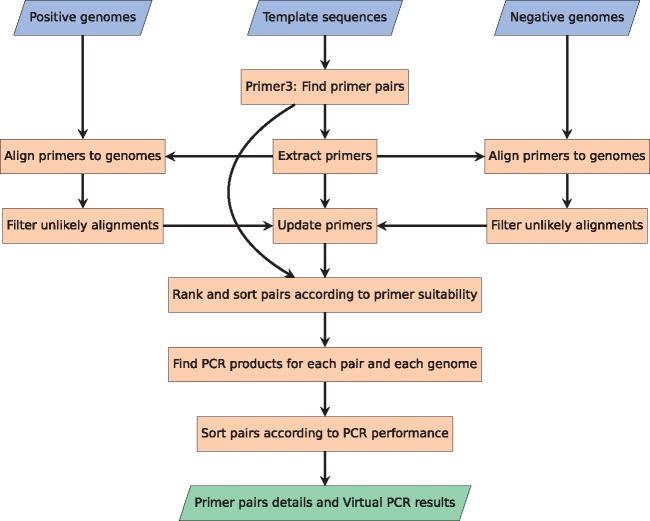
Fig. 2.
Flowchart depicting the process of Method 2. As with figure 1, the three blue parallelogram boxes in the top are input and the green parallelogram box in the bottom is output. To find potential primer pairs, the well-used Primer3 software package is utilized on the template sequences. The identified primers are then aligned to all the provided genomes, and potential alignments to the genomes are stored with the primers. The primers are then ranked and sorted according to their suitability. In the end, each pair is tested for PCR products against all references, and afterwards sorted according to their PCR performance (Color version of this figure is available at Bioinformatics online.)

