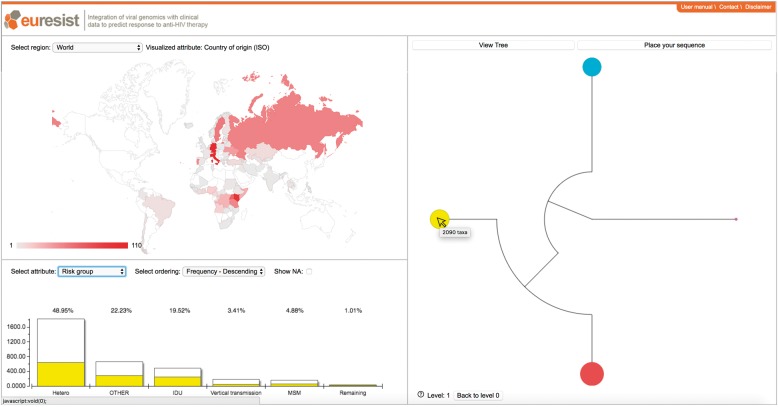
Fig. 1.
The PhyloGeoTool graphical user interface. The upper left panel shows the geographical distribution of the samples present in the selected cluster. The lower left panel shows the distribution for a selected trait of interest; white bars show the distribution for the entire dataset for that level of the tree, whereas the colored bars show the distribution for a specific selected cluster and are annotated by their respective percentage. The right panel shows the clustered phylogenetic tree and allows to perform phylogenetic placement

