
Fig. 6.
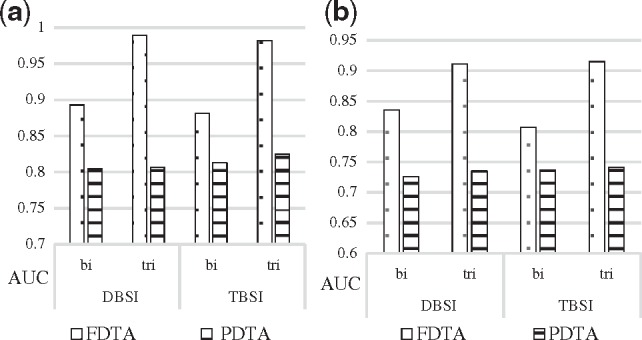
Comparison of average AUC scores of DeepWalk for predicting FDTA and PDTA in Figure 5. AUC scores for FDTA are represented with the dotted bars while PDTA with horizontal lined bars. DeepWalk settings were (γ=40, α=0.01, d=100, w=5, t=40). (a) 10-fold cross-validation, (b) External resource validation