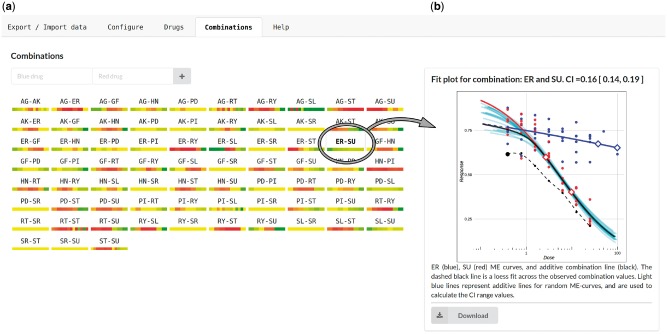
Fig. 1.
An intuitive user inter-face presents the drug synergy assessment for each drug combination in a birds eye overview matrix (a), with color-coded bars for each drug combination to allow for a quick evaluation of synergies (green = synergy, yellow = additivity, red = antagonism). Individual drug combination responses can be inspected more closely with dose–response relationships for each single drug and the drug combination (b), including combination indexes as confidence bands. See Supplementary Material and online help-section for further information

