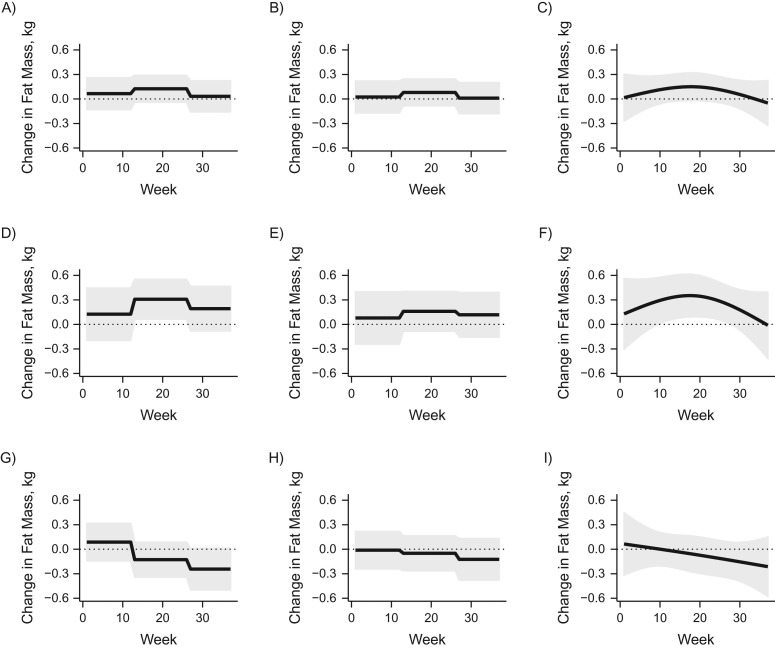
Figure 4.
Results from the analysis of the association between fine particulate matter (PM2.5) and fat mass (kg) in data from the Asthma Coalition on Community, Environment, and Social Stress in the area of Boston, Massachusetts, 2002–2009. The estimates are for all children (n = 224), boys only (n = 130), and girls only (n = 94), each using methods from among joint trimester average exposure (TAE), separate TAE, and distributed lag model (DLM). A) Joint TAE; B) separate TAE; C) DLM; D) joint TAE for boys; E) separate TAE for boys; F) DLM for boys; G) joint TAE for girls; H) separate TAE for girls; I) DLM for girls. For each estimate using DLM, there were 3 degrees of freedom. All estimates were adjusted for maternal race, maternal age, maternal prepregnancy body mass index, maternal educational level, and age of the child when fat mass was measured. The overall estimate was adjusted for child sex. The thick lines show the estimated values, and the gray ribbons show the 95% pointwise confidence intervals.

