Fig. 1.

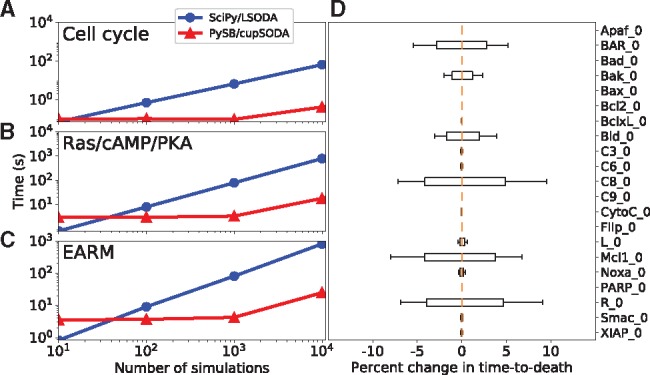
(A–C) Run time comparisons between PySB/cupSODA and SciPy/LSODA for the example models in Table 1 (all simulations performed with the same initial protein concentrations and rate parameters). (D) Sensitivity in time-to-death in EARM to variations (±20%; 25 410 total simulations) in the initial protein concentrations (gold lines are medians; boxes range from the first to third quartile; whiskers extend to the minimum and maximum values). PySB/cupSODA simulations were run using cupSODA 1.0.0 on a GeForce GTX 980 Ti GPU (2816 cores, 16 threads/block); SciPy/LSODA simulations were run on an Intel Xeon E5-2667 v3 @ 3.20 GHz CPU (see Supplementary Table S1)
