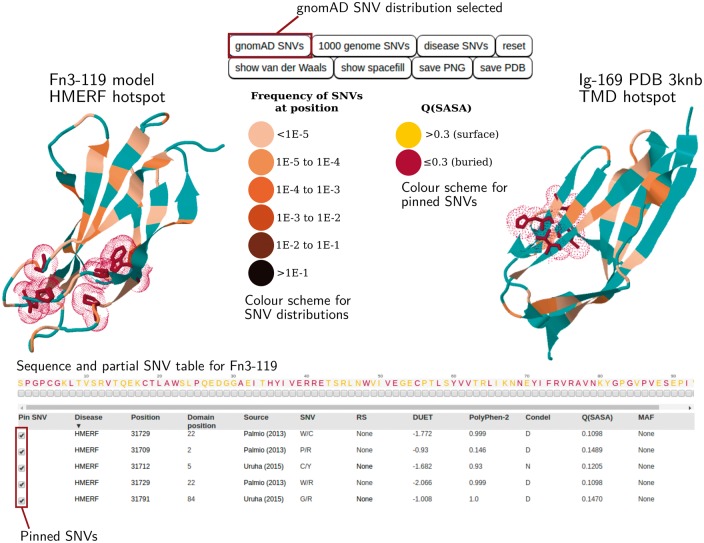
Fig. 1.
TITINdb user interface overview. The HMERF and TMD associated nsSNV hotspots are shown. Users can pin disease-associated nsSNVs from the SNV table onto domain structure and visualize these against the distribution of population nsSNVs (Gnomad or 1000 genomes). Pre-computed in silico analyses are shown in the SNV table (more information can be accessed by scrolling horizontally and vertically)

