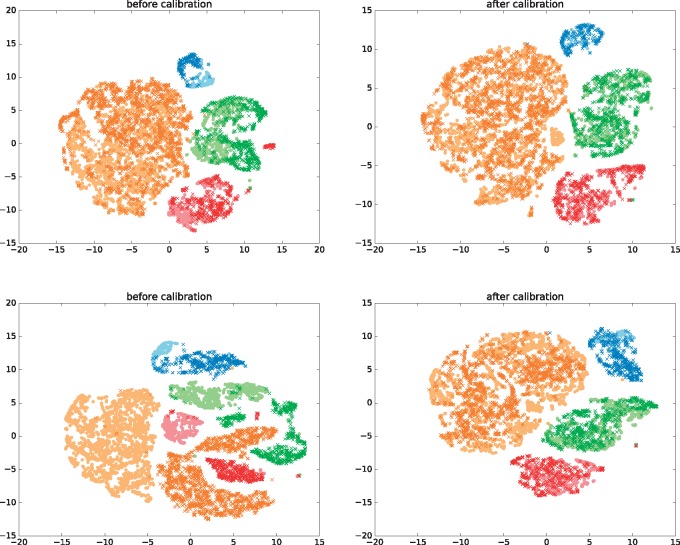
Fig. 4.
Top: t-SNE plots of the joint distribution of sample 7 (dark crosses) and the reference sample (light circles) before (left) and after (right) calibration (the unlabeled cells are omitted). Bottom: Similarly to the upper panel but plots correspond to to the joint distribution of sample 15 and the reference sample. Different cell types have different colors: B cells (light and dark blue), CD4+ T cells (light and dark green), CD8+ T cells (light and dark red), Monocytes cells (light and dark orange). After calibration, same cell types are clustered together

