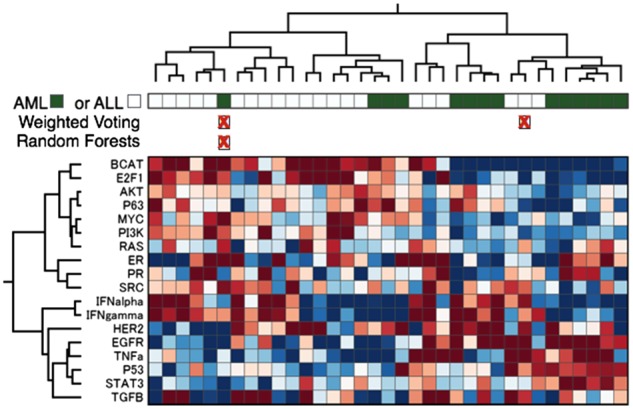
Fig. 4.

Exploratory analyses. This figure shows the results of a supervised machine learning classification (top) and pathway analysis (bottom heatmap) of the ALL/AML test set. Each column contains an AML or ALL cancer sample. In the bar directly below the top dendrogram, AML samples are colored with a dark green box, and ALL white. The following rows indicate the samples, marked with a red X, that Weighted Voting or Random Forests classifiers predicted incorrectly. The heatmap shows the results of a pathway prediction. Red indicates high activation of pathways (rows), and blue low
