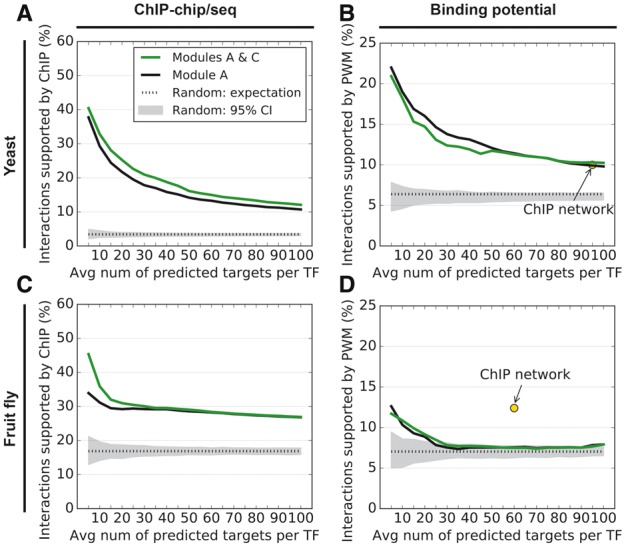
Fig. 2.

(A) Accuracy of NetProphet 1.0 on yeast before weighted averaging (black line) or after weighted averaging (green line). Horizontal axis: number of top ranked edges included in the network per TF encoded in the genome. E.g. since there are 320 TFs in the yeast genome, ‘10’ on the horizontal axis corresponds to a network with 3200 edges. Vertical axis: percentage of edges supported by ChIP data. Dotted line: expected accuracy of random networks. Gray area: 95% confidence interval for randomly selected networks. (B) Same as A for PWM support. The point labeled ‘ChIP network’ indicates the number of ChIP-supported edges and the fraction of those edges that also have PWM support. (C) Same as A for the fly data. (D) Same as B for the fly data, except that the vertical axis shows support by conserved PWM hits only
