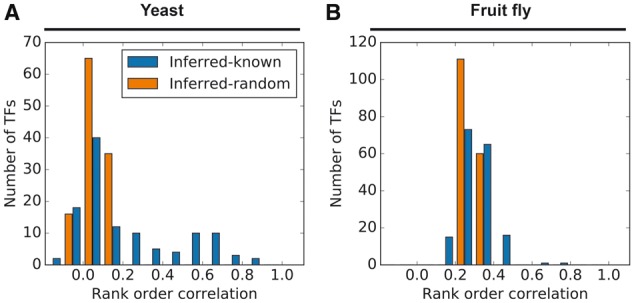
Fig. 5.

Relationships between inferred and known PWMs. Blue bars: distribution of rank order correlations between binding potential scores assigned to each promoter by inferred PWMs and known PWMs. Orange bars: distribution of the medians of rank order correlations between each inferred PWM and the known PWMs for all other TFs. (A) Yeast. (B) Fruit fly
