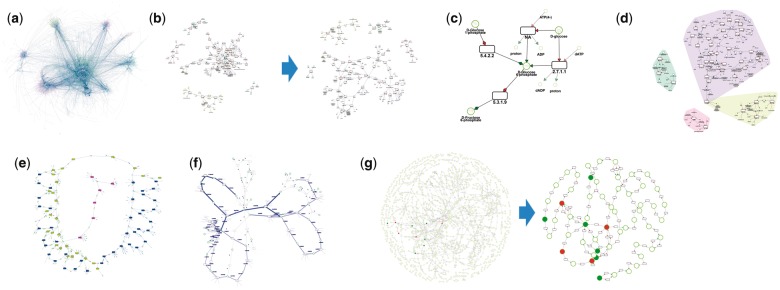
Fig. 1.
Main MetExploreViz features. (a) Visualization of Recon2 human metabolic network containing 7440 reactions (Thiele et al., 2013). (b) Sub-network corresponding to glycolysis pathway in cytosol. Highly connected nodes in grey (ATP, ADP, NAD and NADH) on the left network are duplicated to create the sparser representation on the right. (c) Zoom in view on the metabolic pathway, reversible reactions are depicted using double-headed arrows. Smaller nodes are duplicated side compounds. (d) Compartments where glycolysis is taking place are highlighted using colored convex hulls (e.g. cytosol in top right corner). (e) Sub-network with discrete values mapped on reactions. (f) Flux values mapped on edges around reactions. (g) KEGG network of Saccharomyces cerevisiae with metabolomics dataset from (Madalinski et al., 2008) mapped (dark nodes). On the right the sub-network automatically obtained using the algorithm computing the union of lightest paths implemented in MetExploreViz (Color version of this figure is available at Bioinformatics online.)

