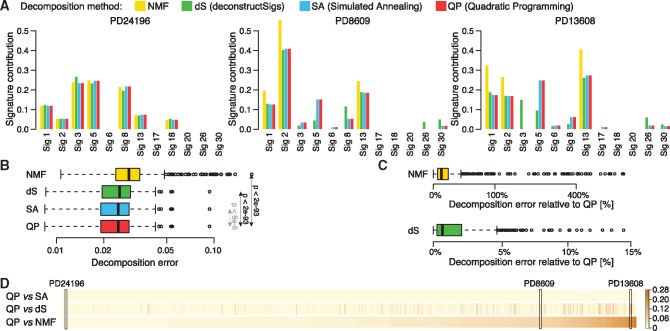
Fig. 1.
Comparison of four decomposition methods. The decomposition of patient’s mutational profile into 12 mutational signatures known to be present in breast cancers was inferred using four different methods for each of 560 patients. (A) Three examples comparing four methods shown as barplots. (B) Distribution of decomposition errors (the root sum-squared error between observed and inferred mutational profile) compared between four method across 560 breast cancer patients. Statistical significance of difference between decomposition errors of QP and three other methods is shown (paired Wilcoxon test); Cohen’s d effect size of difference between decomposition errors of QP and SA is negligible. (C) Decomposition errors for NMF and dS relative to QP errors shown in the log scale (y axis). (D) Comparison of cosine distance between signature contributions inferred using QP and three other methods shown for all patients. Patients were sorted based on their distance between QP and NMF solutions. Three patients selected as the examples in (A) are marked

