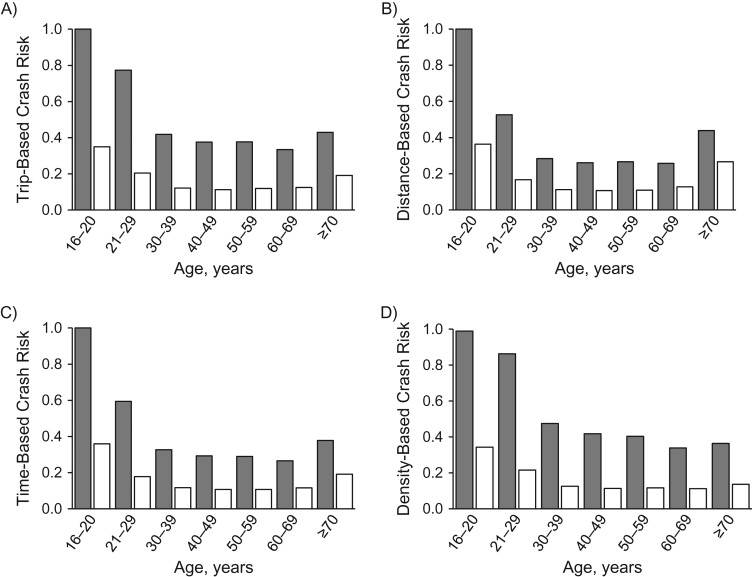
Figure 2.
Trip-based (A), distance-based (B), time-based (C), and density-based (D) fatal crash risk by driver age range and sex, United States, 2002–2012. Gray indicates men, and white indicates women. Fatal crash risks are presented as rescaled values calculated by dividing the value of each driver group by the largest value across driver groups, where rescaled crash risk equals 1 for the driver group with the highest crash risk. Fatal crash risks are based on annual single-car and 2-car driver fatalities and annual travel and population numbers.

