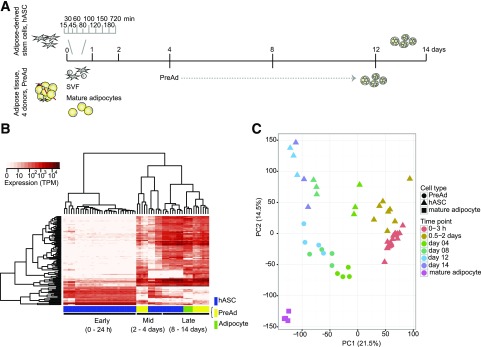
Figure 1.
Experimental set up and model system comparison. A: Model system and sampling schematic. B: Hierarchical clustering of the 100 promoters with the highest variance in all samples that passed quality control. C: Principal component (PC) analysis of promoters with at least 10 tags per million (TPM) expression level in at least one sample. The two components capturing the highest variance are plotted.

