Figure 5.
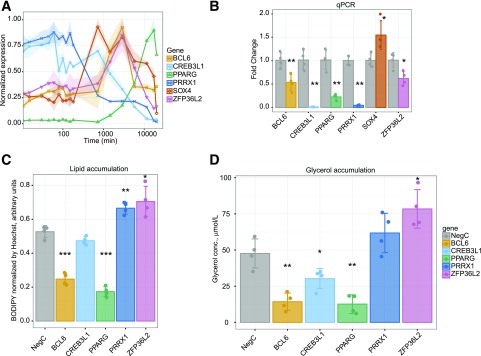
TFs BCL6, CREB3L1, PRRX1, and ZFP36L2 have effects on adipogenesis. A: Temporal expression during adipogenesis from CAGE data of four TFs identified in a screen for early/transient TFs that affect adipogenesis when knocked down using siRNA. The x-axis is log-scaled time in minutes. B: RT-qPCR data showing efficiency of siRNA knockdown for each candidate TF and the positive control PPARG. Cells were electroporated with siRNA day −1 of differentiation and RNA harvested at day 1 (48 h after transfection) of differentiation. C: Intracellular lipid accumulation as measured by neutral lipid staining (BODIPY) normalized to cell number (Hoechst staining of nuclei) of cells with candidate TFs knocked down at day −1 of differentiation. D: Glycerol concentration in cell culture medium as a measure of lipolysis. Concentrations measured at day 9 of differentiation of cells with candidate TFs knocked down at day −1 of differentiation. Each point represents an individual measurement, each bar the mean value, and each error bar SD. Four independent experiments; significance compared with negative control calculated by Student t test with Benjamini–Hochberg corrected *P < 0.05; **P < 0.01; ***P < 0.001.

