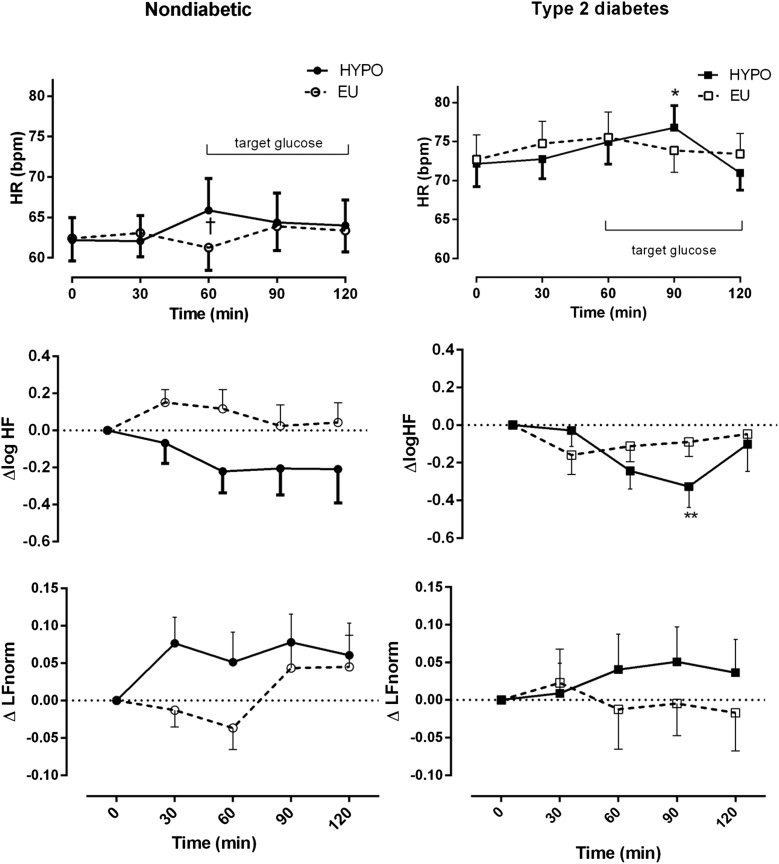
Figure 2.
Heart rate and change in HRV during hypoglycemia (HYPO) in patients with T2DM and control participants without diabetes. ○, EU clamp, control participants without diabetes; □, EU clamp patients with T2DM; ●, HYPO clamp, control participants without diabetes; ■, HYPO clamp, patients with T2DM. Data are mean (SE). *P < 0.05, **P < 0.01 compared with baseline; †P < 0.05 euglycemia (EU) vs. HYPO. HR, heart rate.

