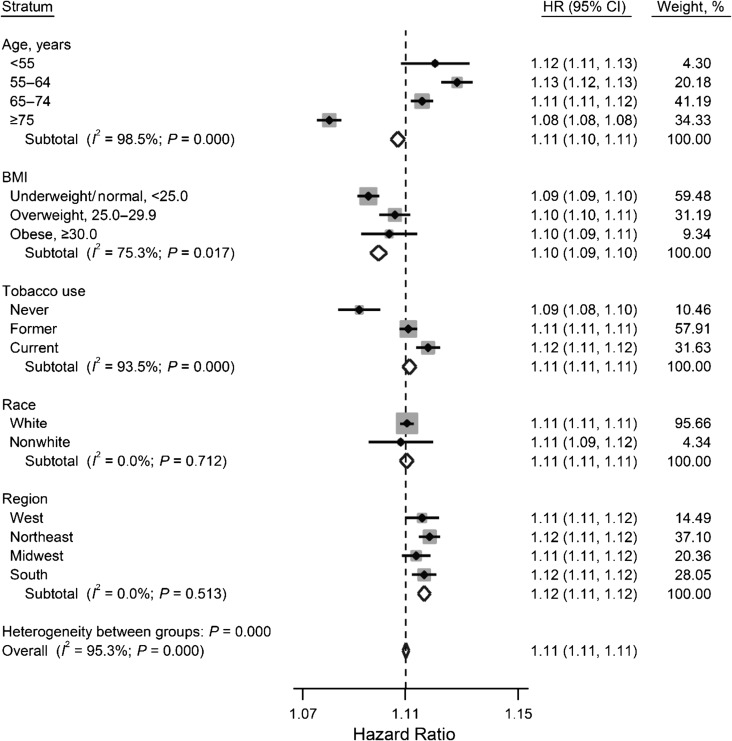
Figure 3.
Forest plot displaying adjusted Cox proportional hazards ratios (HR) for mortality by participant characteristics and the overall estimate for each point increase in the multimorbidity-weighted index, Nurses’ Health Study (2000–2010), Health Professionals Follow-Up Study (2000–2010), and Nurses’ Health Study II (2001–2010). The overall model estimate was adjusted for all covariates, including age, body mass index (BMI; calculated as weight (kg)/height (m)2), tobacco use, race, and geographic region; models within each stratum were adjusted for all other covariates. Boxes represent the hazard ratios by strata of participant characteristics, whereby the size of the box is proportional to the weight assigned to the characteristic (i.e., larger boxes represent larger sample sizes). The dotted vertical line represents the combined overall estimate. The horizontal lines represent the 95% confidence intervals (CI) around the estimates. The width of the diamond represents the 95% confidence interval around the overall estimate.

