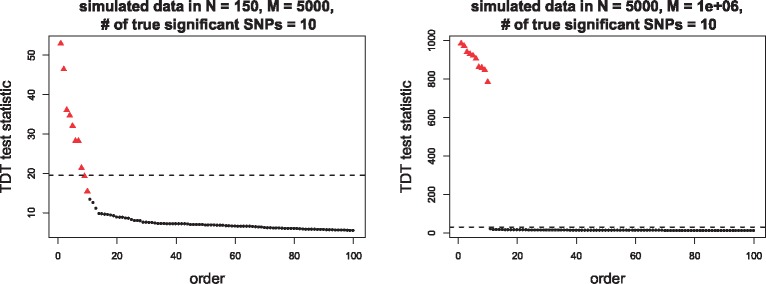
Fig. 4.
Top 100 largest TDT test statistics in the simulated data. The left panel is from a small cohort (with family number N = 150 and SNPs number M = 5000) and the right panel from a large cohort (with N = 5000 and M = 106). The triangle points are the true top 10 significant SNPs. The horizontal dashed lines are the thresholds at 100(1–0.05/M)%-quantile of distribution, where M = 5000, 106 in left and right panels respectively

