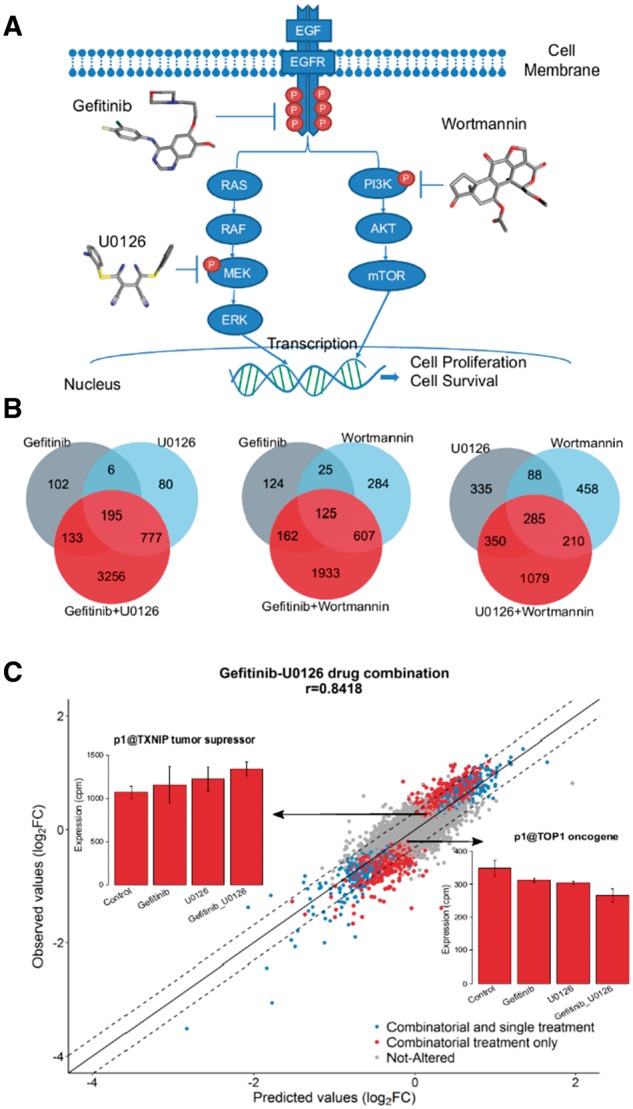
Fig. 1.

Promoter expression after combinatorial treatment. (A) EGFR pathway: Gefitinib, U0126 and Wortmannin directly inhibit the activity of EGFR, ERK and Akt pathway, respectively. (B) Venn diagrams showing the number of significantly altered promoters after single and combinatorial drug treatments. (C) Scatter plot of observed versus predicted log2FC values for the Gefitinib_U0126 drug combination. Blue dots indicate promoters differentially expressed both in single and combinatorial treatment, red dots denote promoters differentially expressed only in combinatorial treatment and gray dots represent the non-significantly altered promoters. The dashed lines define the bounds for the two standard deviations of the residual error. See also Supplementary Figure S2. Barplots show the expression of tumor suppressor TXNIP and oncogene TOP1 after single and combinatorial treatment of Gefitinib and U0126
