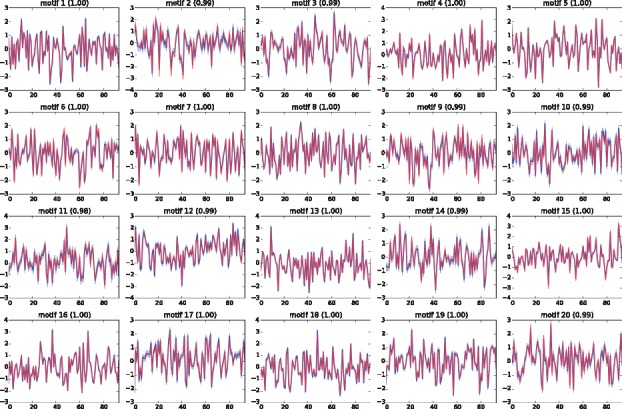
Fig. 1.

The recovered motif activities (blue) by SITAR are compared with the ground truth activities (red). Their Pearson correlations are shown in the parentheses. For all subplots, x-axis shows the time and y-axis shows the normalized activities of corresponding motifs (Color version of this figure is available at Bioinformatics online.)
