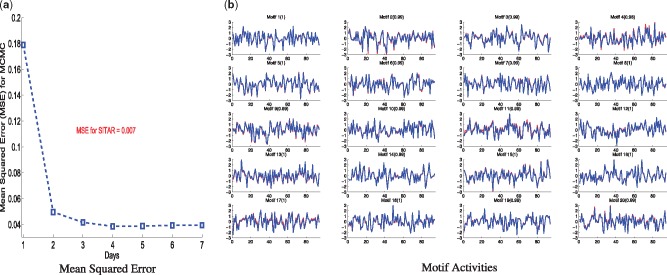
Fig. 2.
Application of MCMC method (Iqbal et al., 2012) to synthetic data, (a) Mean Squared Error (MSE) against the running time for MCMC(single MSE value for SITAR is shown in red), (b) Recovered motif activities by MCMC (red) are compared with the ground truth activities (blue), Pearson correlations are shown in the parentheses. For all subplots, x-axis shows the time and y-axis shows the normalized activities of corresponding motifs (Color version of this figure is available at Bioinformatics online.)

