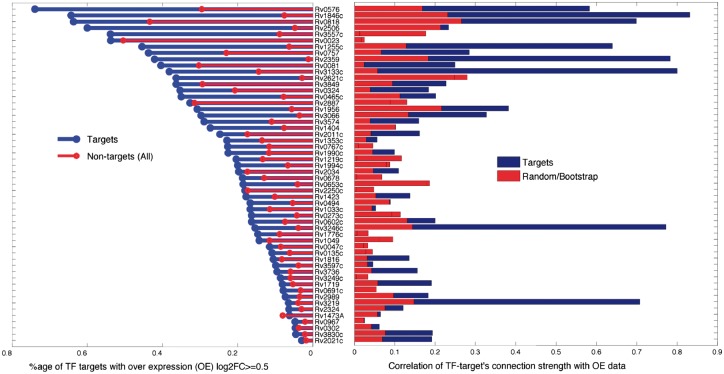
Fig. 4.
Validation of our predictions against TF over-expression data from Rustad et al. (2014). The y-axis, showing 54 TFs which have at least 10 significant targets predicted by our method, is shared among two subplots. For each TF, the left panel shows the proportion of targets with log2 fold change (log2FC) ≥0.5 (blue for targets, red for non-targets), while in this data the average ratio of enrichments for targets and non-targets is 3.5. The right panel shows the absolute correlation of over-expression log2FC against the connection strength predicted by the model, blue for targets while red is the background calculated by randomly permuting the connection strength for the given TF targets, averaged over 100 iterations (Color version of this figure is available at Bioinformatics online.)

