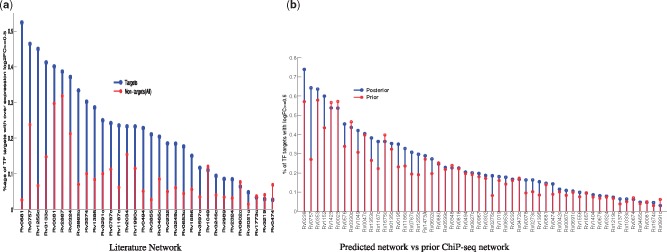
Fig. 5.
(a) Validation of a smaller MTB network published in Galagan et al. (2013) against the TF over-expression data. We only used TFs which are in our input network and for which there is OE data. For each TF, we plot the proportion of targets with absolute log2 fold change (log2FC) ≥0.5 (blue for targets, red for non-targets in that network). These analysis was further restricted to TF with at least 10 targets. (b) Based on 54 TFs reported in Figure 4, further comparison of our predictions (blue) with the prior network (red) obtained from ChIP-seq data only. The average ratio of enrichments for targets over non-targets for (a) is 3.2 while 1.25 for (b) (Color version of this figure is available at Bioinformatics online.)

