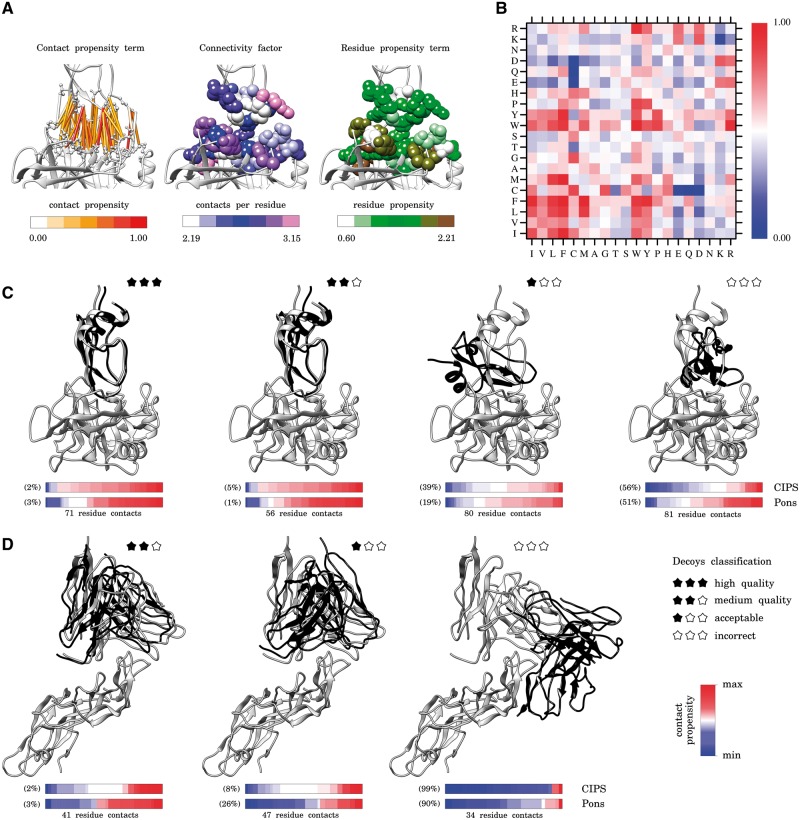
Fig. 1.
CIPS propensity matrix and scoring of docking decoys. (A) Representation of the three components of CIPS propensity: residue–residue contact propensity (left), connectivity level of interface residues (centre), and residue propensity at the interface (right). The contact propensity term is computed with Equation (2) and normalized in [0, 1]; the number of contacts for amino acid k is the value vk in the expression of in Equation (3); the residue propensity of amino acid k is the value from Negi and Braun (2007). (B) CIPS propensity matrix computed on PPDB v5.0 with Equation (1) by combining the three numerical components illustrated in (A). (C and D) For each complex, the receptor is fixed (grey, at the bottom) and the docking solution (black) and the native conformation (grey) of the ligand are shown on the top. The bar below each structure is coloured according to the propensity value (either from CIPS or Pons definition) of each contact at the interface; namely, for CIPS matrix, Pi,j values are represented and coloured according to the gradient reported in (B). All contacts are represented and ordered from lower to higher propensity values. The number of inter-protein residue contacts is reported below the bars; their number depends on the distance between receptor and ligand (compare structures of C and D). Note that CIPS and Pons values are not directly comparable. To account for this, we report the percentage ranking of the depicted structures within the set of decoys for the same complex. (C). Four docking decoys from Dockground decoy benchmark for trypsin (receptor) in complex with trypsin inhibitor (ligand) (PDB code: 2FI4). (D) Three docking decoys from CCD benchmark for antigen (receptor) in complex with antibody (ligand) (PDB code: 1QFW). Molecular graphics are performed with the UCSF Chimera package (Pettersen et al., 2004) (Color version of this figure is available at Bioinformatics online.)

