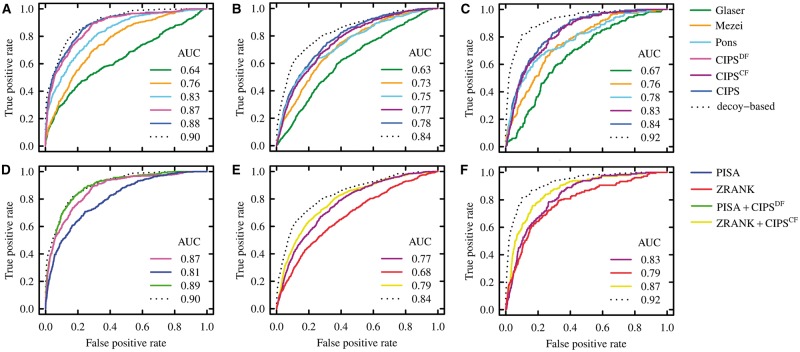
Fig. 2.
Discriminative power of pair potentials, of atomic potentials, and of the combination of the two on all-atom versus coarse-grain decoys datasets. ROC curves are computed on the union of the decoy sets and AUC values are reported for each method. (A–C) The score used is the average contact propensity at the interface [see Equation (5)]. Dotted lines refer to the performances of the decoy-based potential, a propensity defined as the log-ratio between the contact frequency on near-native and non–near-native decoys (see Supplementary Section S1.8). (D–F) The best performing pair potentials and atomic potentials on Dockground_ decoy_ filtered (DF) and CCDMintseris_ filtered (CF), and their combination. PISA + CIPSDF and ZRANK + CIPSCF are defined as in Equation (S1). (A and D) Analysis of DF. (B and E) Analysis of CF, with acceptable decoys labelled as near native. (C and F) Analysis of CF, with medium quality decoys labelled as near native. ROC curves and AUC values are computed with the R packages ROCR (Sing et al., 2005 and Tuszynski, 2014) (Color version of this figure is available at Bioinformatics online.)

