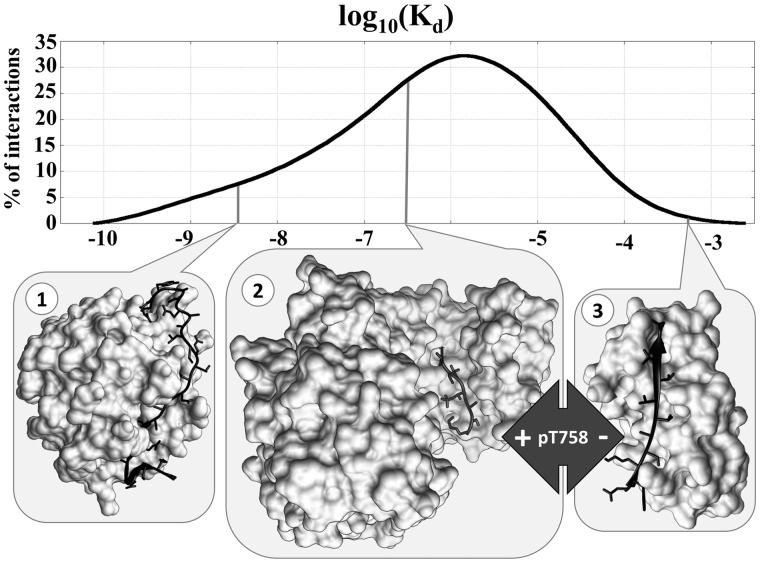
Fig. 1.
Kd values in DIBS. Distribution of Kd values of interactions in DIBS (top), together with three selected examples with differing biological functions and, correspondingly, differing Kds (bottom). Interactions 2 and 3 contain the same disordered protein segment in different post-translational modification states binding to different partners

