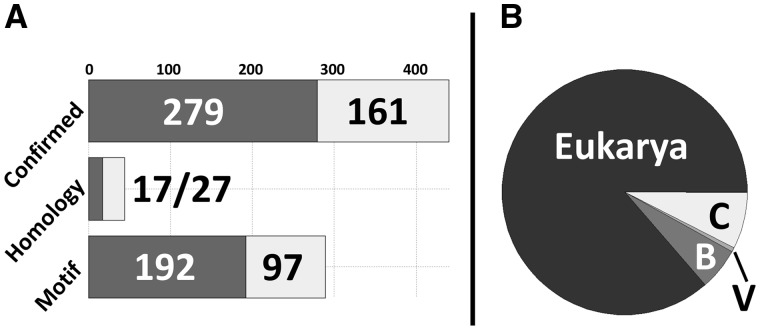
Fig. 2.
Distribution of data in DIBS. (A) Distribution of DIBS entries with regards to various types of disorder annotation. Dark grey boxes represent entries for which Kd values are available and light grey boxes mark entries without known Kd values. (B) Taxonomic distribution of the 773 complexes in DIBS (B—Bacteria, V—Viruses, C—Cross-domain interactions). While archaeal proteins form parts of cross-domain interactions, no purely archaeal interactions are currently available

