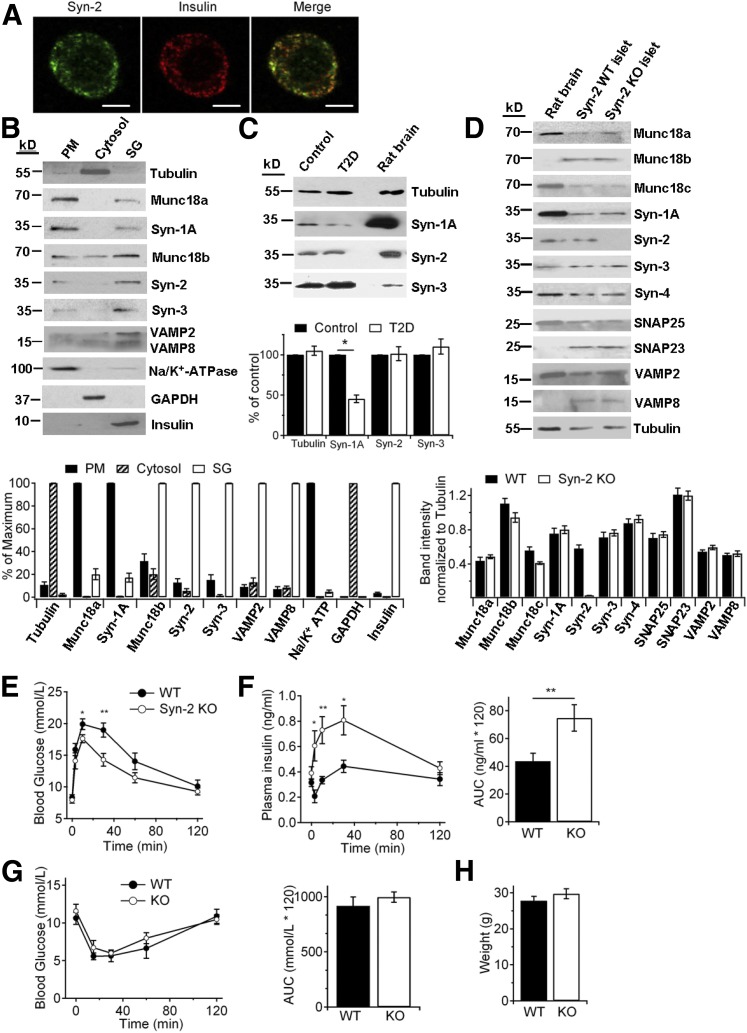
Figure 1.
Syn-2 deletion improves GSIS and glucose homeostasis. A: Representative immunofluorescence images of Syn-2 (green) with insulin (red) in mouse pancreatic β-cells, with their colocalization shown in merge images (yellow). Shown are representative images of three independent experiments. Scale bars, 5 μm. B: Subcellular distribution (PM, 20 μg protein), cytosol (20 μg), and SG (20 μg) of Syn-1A, -2, -3, and their cognate SM proteins in INS-1 cells. Na+/K+-ATPase, GAPDH, and insulin were used as positive markers for PM, cytosol, and SG, respectively, to verify the purity of each fraction. For analysis (N = 3; bottom), the level in each fraction was expressed as a percentage of the signal of the strongest (maximum) band. C: Western blot (top) and analysis (N = 3; bottom) of syntaxin isoform levels in normal and T2D human pancreatic islets (25 μg protein). Rat brain (5 μg) was used as positive control. D: Western blot of SNARE and SNARE-associated protein levels in pancreatic islets of WT and Syn-2–KO mice (25 μg protein). Rat brain (5 μg) was used as positive and negative control. For analysis (N = 3; bottom), the level of each protein was normalized to the tubulin band. IPGTTs were performed with blood glucose levels in E and insulin secretion in F assessed during IPGTT. Insulin secretion is shown as AUC encompassing 120 min of IPGTT (F, right). N = 19/group. G: Blood glucose levels during IPGTT and corresponding AUC encompassing 120 min of IPGTT (right). N = 8/group. H: Weights of WT and Syn-2–KO mice used to perform IPGTT or insulin tolerance tests. Results are shown as mean ± SEM. *P < 0.05; **P < 0.01.

