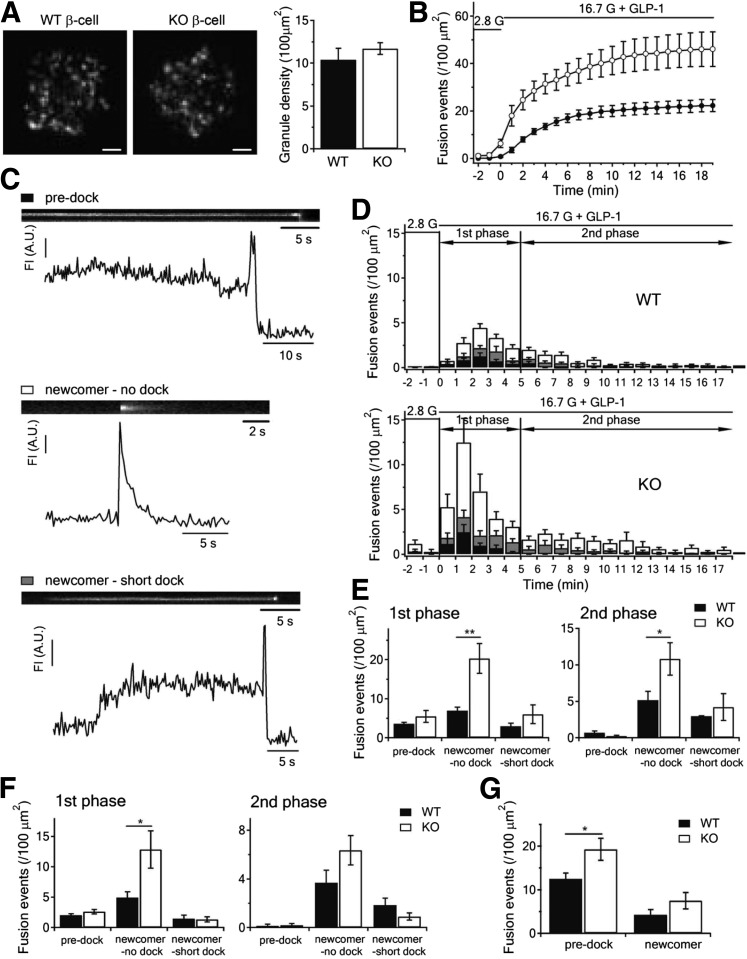
Figure 3.
Syn-2 deletion increases newcomer SG exocytosis during biphasic GSIS. A: TIRFM images of docked insulin SGs in WT or Syn-2–KO β-cells (left). Scale bars, 2 μm. Averaged SG densities before stimulation (right). B: Cumulative insulin SG fusion events per cell per 100 μm2 stimulated as indicated. C: Kymographs and corresponding fluorescence intensity (FI) curves showing three modes of insulin SG fusion events: predock (black bar), newcomer-no dock (white bar), and newcomer short-dock (gray bar). D: Histogram of fusion events in first (first 5 min after 16.7 mmol/L glucose plus 10 nmol/L GLP-1 stimulation) and second phases (5–18 min) in WT versus KO β-cells. Data obtained from four independent experiments (three to five cells from each experiment). Summary of the three modes of fusion events in first (left) and second phases (right) stimulated by 16.7 mmol/L glucose plus 10 nmol/L GLP-1 in E or by 16.7 mmol/L glucose in F. For corresponding histogram of fusion events for F, see Supplementary Fig. 3A. G: Summary of predocked and newcomer fusion events stimulated by 50 mmol/L KCl. For corresponding histogram of fusion events, see in Supplementary Fig. 3B. Summary graphs shown as mean ± SEM. *P < 0.05; **P < 0.01. A.U., arbitrary units.

