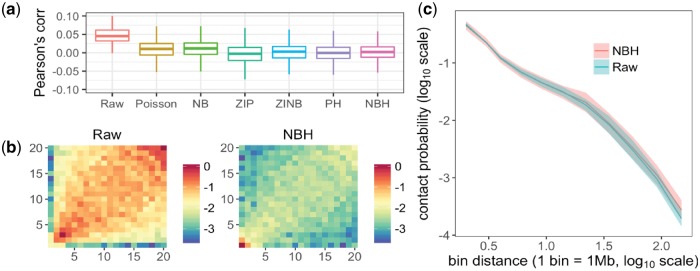
Fig. 1.
(a) Pearson’s correlation coefficients between Hi-C data (Raw and normalized) and the mappability feature. (b) An individual cell’s Hi-C heat map associated with mappability before and after normalization using NBH method (details see Supplementary Results). (c) The normalized Hi-C data via NBH method achieve larger standard deviations (variances) than raw Hi-C data

