
Fig. 1.
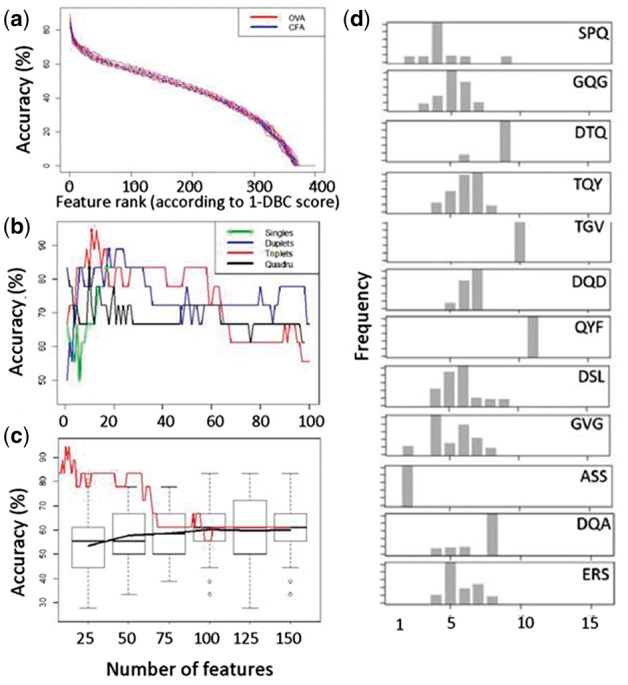
(a) The ranked 1-DBC classification efficiency for all amino acid duplets. Each line represents the trajectory for a different ‘outer’ leave-one-out selection. (b) Classification accuracy using an SVM trained on increasing numbers of p-tuples. The p-tuples were selected on the basis of decreasing classification accuracy in the 1-DBC. (c) Comparison of (b) to classification accuracy using an SVM trained on increasing numbers of randomly selected triplets (box and whiskers plot shows median, inter-quartile range and range for 100 different random samples). Solid black line shows means of random features. Red line shows the performance of triplets selected on the basis of decreasing classification accuracy in the 1-DBC (as in b). (d) The relative positional distribution of the top twelve ranked triplets (by 1-DBC classification score) along the CDR3. The histograms show the percent times that each triplet starts at that relative position, using a sample of TCRβ CDR3s from all repertoires combined. Since the TCRβ CDR3s are of different length, the starting position of each feature is calculated as a proportion of the CDR3 length