
Table 1.
The classification accuracy of combined 1-BDC and SVM on all repertoires analyzed1
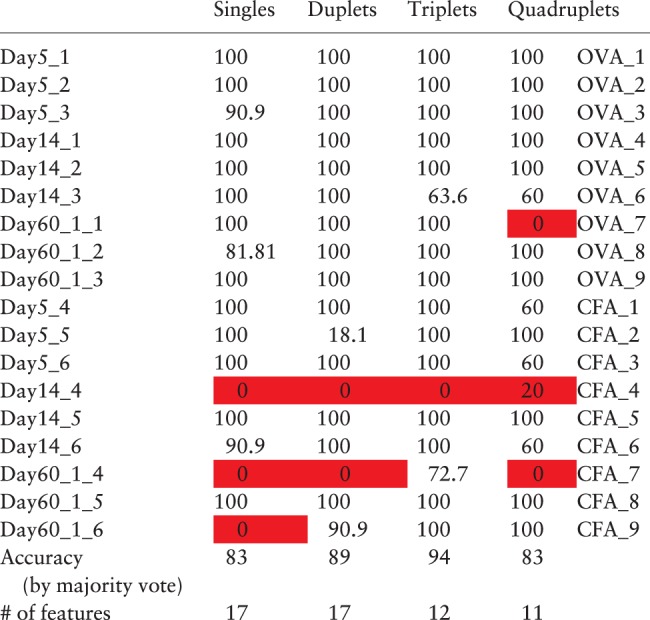 |
1The results of the SVM classifier using the top features ranked according to 1-DBC score. The number of features used is shown in the last row. Each row shows the % correct classification for one left-out repertoire, using 11 samples of 100 000 TCRβ CDR3s from that repertoire as test (solid background indicates misclassified cases). The penultimate row shows the overall classification efficiency, where the classification of each mouse is made by majority vote.