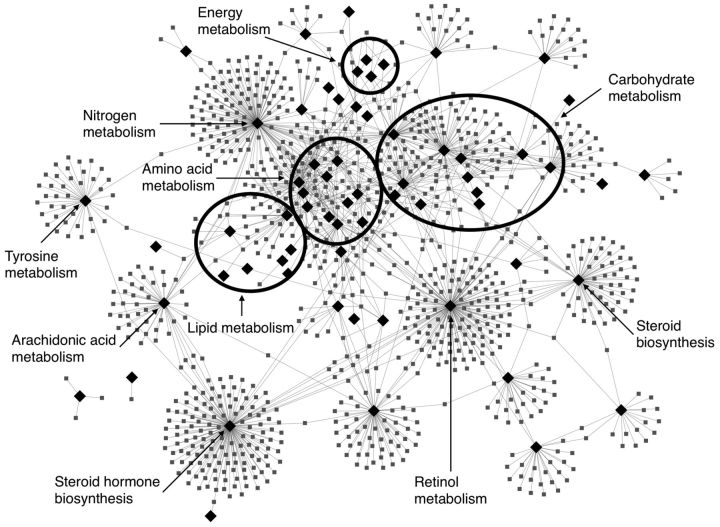
Fig. 4.
Bipartite metabolic pathway – disease network identified by ConceptMetab and displayed in Cytoscape. Black diamonds represent pathways; grey squares are diseases. The ovals in the center represent groups of several KEGG pathways, e.g. carbohydrate metabolism includes amino sugar, nucleotide sugar, galactose, fructose and mannose metabolism

