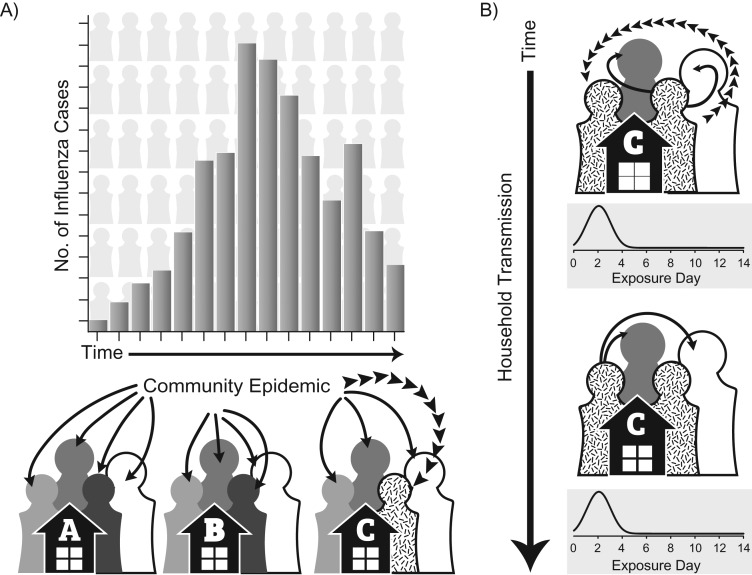
Figure 1.
Conceptual diagram of the individual-based transmission hazard model indicating hazard of infection from the community (A), and hazards of infection from infected household contacts (B). A) The hazard of influenza infection from the community is modeled for each individual household member for each day of the influenza season and is indicated by solid arrows. This hazard varies by time proportionally to weekly influenza cases reported to the Michigan Department of Health and Human Services Disease Surveillance System (18). Individual 3 from household C is infected from the community as indicated by broken arrows. B) The hazard of infection within the household is modeled for each individual in the household who is exposed to each infected household contact for a 14-day period beginning on the date of illness onset of the infected contact and is indicated by solid arrows. The hazard of infection within the household is proportional to a Weibull distribution representing the serial interval. Individual 1 from household C is infected by their infected household contact (individual 3) as indicated by broken arrows. The hazard of infection from individual 1 is then modeled for the remaining susceptible household contacts for an additional 14-day period. No additional infections are observed. All individuals, unless infected, remain at risk of infection from the community during these 14-day household exposure periods.

