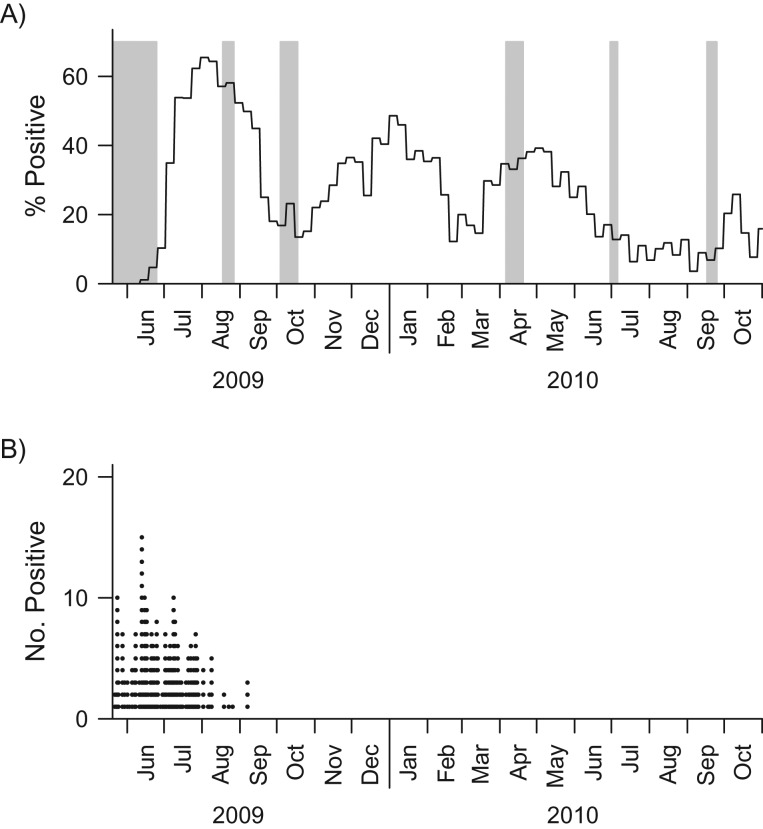
Figure 1.
Blood collection period for the community cohort and distribution of the daily numbers of influenza A(H1N1)pdm09 cases detected in the real-time polymerase chain reaction (RT-PCR) cohort during the influenza A(H1N1)pdm09 outbreak in Singapore, 2009–2010. The gray bars in part A indicate the timing of serum samples taken from the community cohort. The solid black line in part A represents the weekly relative proportions of influenza A(H1N1)pdm09 infections obtained from routine primary care surveillance, which provides a reference for the size of the pandemic at the community level. There were 757, 624, 690, 679, 624, and 556 samples collected during waves 1–6, respectively. The black dots in part B give the daily numbers of A(H1N1)pdm09 cases identified in the RT-PCR cohort.

