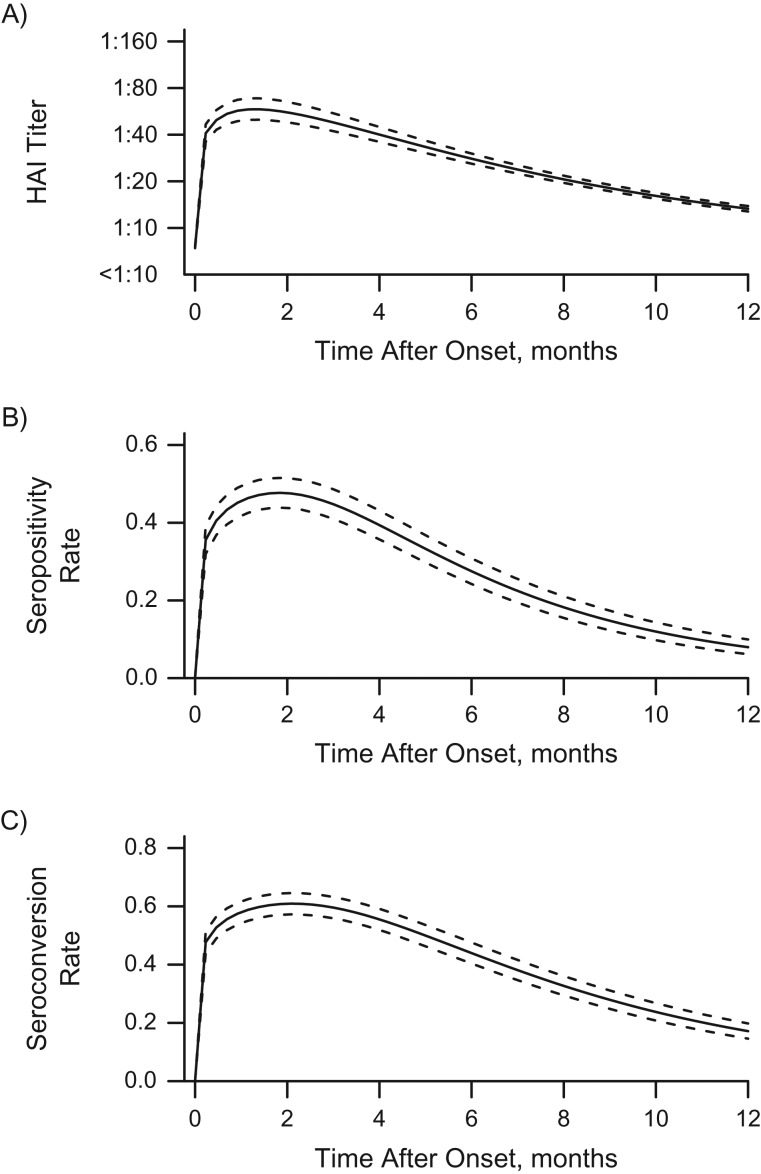
Figure 4.
Individual-level dynamics for the modeled hemagglutination-inhibition (HAI) antibody titer trajectory (A), the probability of having titers greater than or equal to 1:40 (B), and the probability of seroconversion (C) over time during the influenza A(H1N1)pdm09 outbreak in Singapore, 2009–2010. The solid lines represent the estimated mean values, and the dashed lines represent the 95% credible intervals. In part A, the uncertainty interval bounded by the dashed lines is the 95% credible interval for the estimated mean titer.

