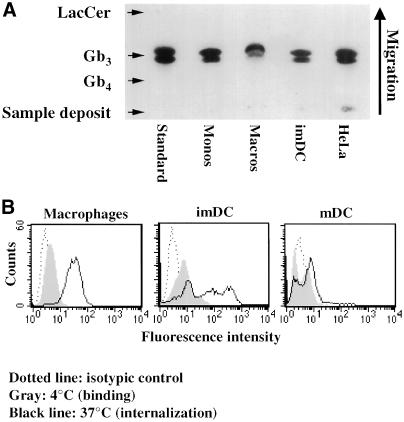
Figure 1.
(A) TLC analysis of Gb3 expression in various cells. Neutral glycolipids were extracted from 1 × 10⁷ monocytes, 2 × 10⁷ macrophages, 2 × 10⁷ imDCs, and 1 × 10⁶ HeLa cells, separated by TLC, and Gb3 was detected and quantified (Table 1) by overlay with STxB. (B) FACS analysis of STxB binding to and internalization into monocyte-derived cells. Fluorescein-labeled STxB (0.1 μM; 5 μg/ml) was incubated on ice (gray profiles) or for 30 min at 37°C (black lines) with the indicated cells that were then analyzed by FACS. Background signal of nonlabeled cells is also shown (dotted lines). Note the weak but detectable binding after incubation on ice and strong signal after incubation at 37°C.

