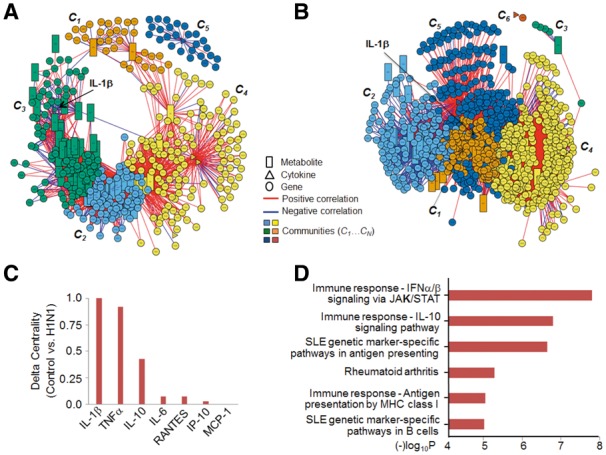
Fig. 1.

Integrative network analysis of cytokine, metabolome and transcriptome datasets from a study of H1N1 virus infection of mice. (A). Using only control samples. Five communities (C1…C5; represented by different colors) were detected using the multilevel community detection algorithm (Supplementary Table S2). (B) Using only H1N1 infected samples. Six communities (C1…C6) were detected (Supplementary Table S3). (C) Delta centrality based on the ECM, |ECMcontrol – ECMH1N1|, for the cytokines in the integrative networks in (A) and (B). (D) Pathway analysis of genes with delta centrality (|ECMcontrol – ECMH1N1|) > 0.1 using MetaCore (https://portal.genego.com/); only top 5 pathways are shown). Note: (rectangle: metabolite, circle: gene, triangle: cytokine)
