
Fig. 4.
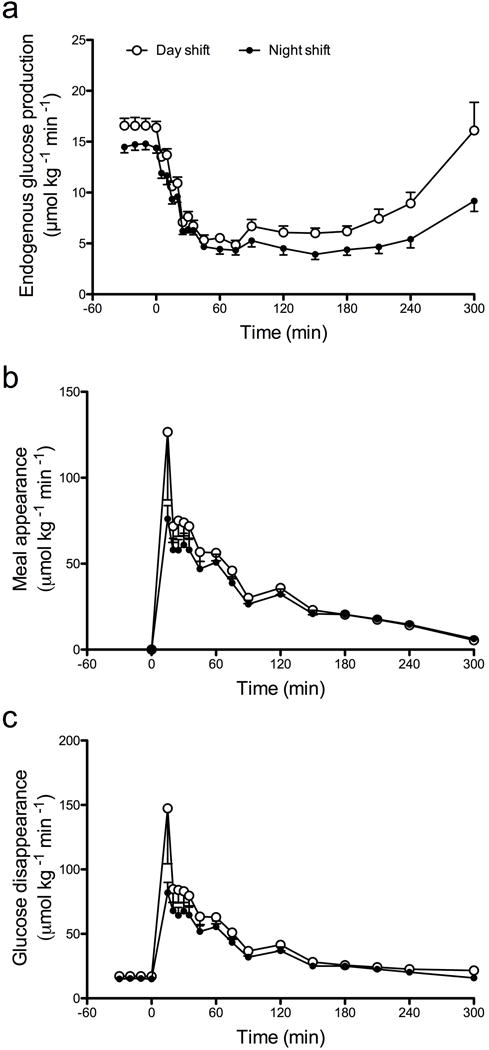
EGP (a), rate of meal appearance (b) and rate of glucose disappearance (c) during the day shift (white circles) and night shift (black circles). Values represent means ± SEMs.
Official websites use .gov
A
.gov website belongs to an official
government organization in the United States.
Secure .gov websites use HTTPS
A lock (
) or https:// means you've safely
connected to the .gov website. Share sensitive
information only on official, secure websites.
EGP (a), rate of meal appearance (b) and rate of glucose disappearance (c) during the day shift (white circles) and night shift (black circles). Values represent means ± SEMs.