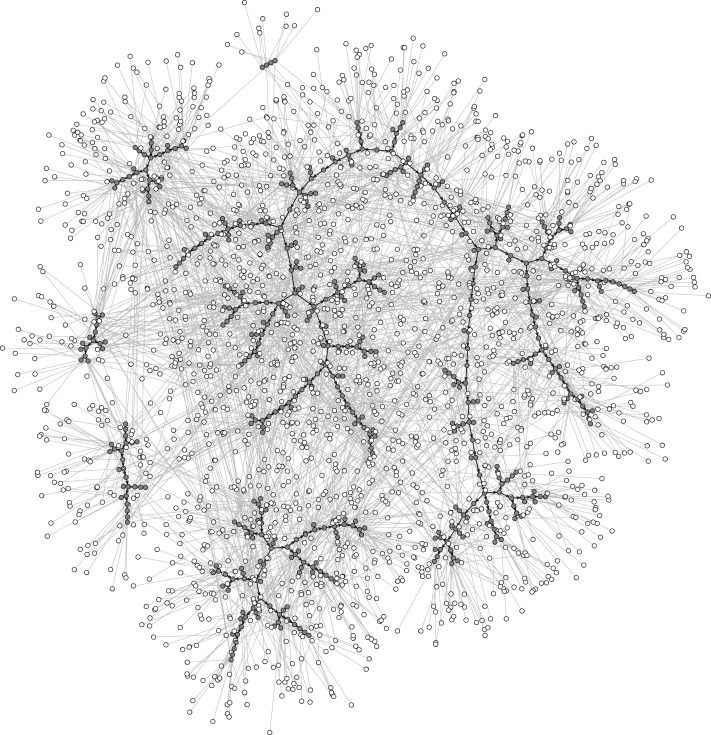
Figure 2.
The nomination network and recruitment graph for injection drug users in the RDS-net study conducted in Hartford, Connecticut, 2012–2013. Recruited subjects are shown in dark gray, and recruitment edges are shown as a directed edge (arrow) from the recruiter to the recruitee. Nonrecruitment edges (linking recruited subjects to unrecruited subjects, or recruited to recruited subjects) are shown as light gray lines.

