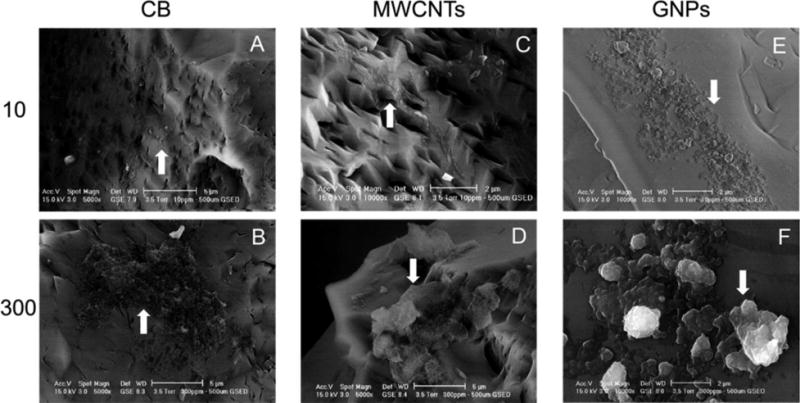
Figure 6.

Environmental scanning electron microscopy (ESEM) images of either 10 or 300 mg L−1 (A, B) carbon black (CB), (C, D) multiwalled carbon nanotubes (MWCNTs), or (E, F) graphene nanoplatelets (GNPs) dispersed into the filtered soil extract then deposited onto clean quartz sand. Scale bars are either 5 (A, B, D) or 2 μm(C, E, F). White arrows indicate either dispersed nanomaterials at the lower concentration (10 mgL−1; A, C, E) or larger nanomaterial agglomerates at the higher concentration (300 mg L−1; B, D, F).
