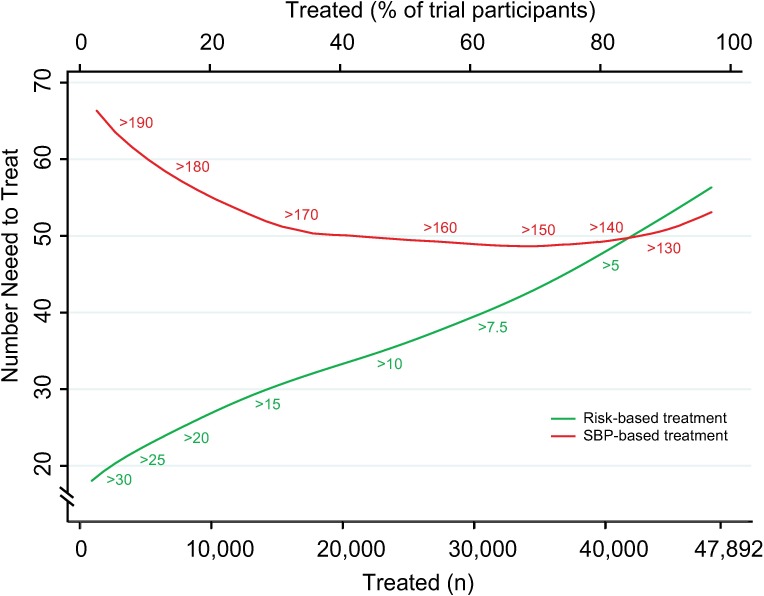
Fig 2. Numbers needed to treat for 5 y to avoid 1 cardiovascular event according to CVD risk and SBP treatment strategies.
Numbers needed to treat for 5 y to avoid 1 cardiovascular event as a function of number of persons and proportion of sample treated using a CVD risk strategy (in green) and an SBP strategy (in red). Numbers associated with each curve represent the specific CVD risk level (percentage 5-y CVD risk) or SBP (mmHg) at the treatment threshold. CVD, cardiovascular disease; SBP, systolic blood pressure.

